 |
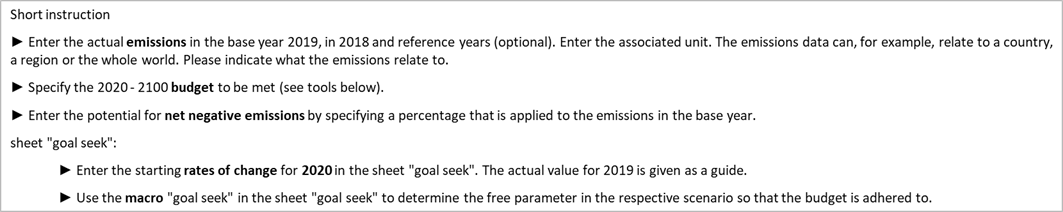
|||
 |
|||
"goal seek"
normalised value
(= increasing emissions after 2019)


emissions (-NNE) + supplement
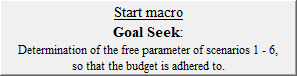
| Determination of the free parameter in the RM Scenario Types 2020 - 2100 |
|
|||||||||||||||||||||||||||||||||||||||||
| target cell "goal seek" |
changeable cell "goal seek" | target value "goal seek" | target is not met | |||||||||||||||||||||||||||||||||||||||
| input values | target is met | |||||||||||||||||||||||||||||||||||||||||
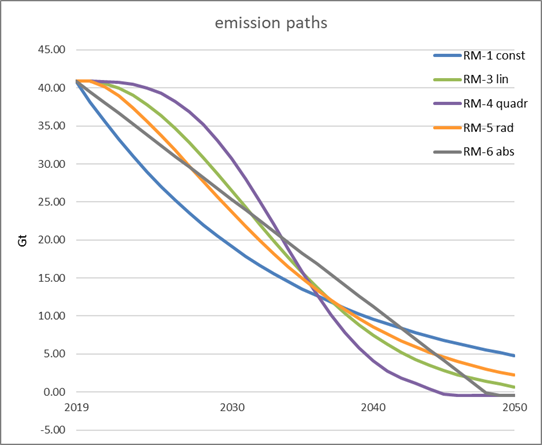
| RM Scenario Type: | RM-1 const | RM-2 exp | RM-3 lin | RM-4 quadr | RM-5 rad | RM-6 abs | ||||||||||||||||||||||||||||||||||||
| RRt const | RRt exp | RRt lin | RRt quadr | RRt rad | RA const | |||||||||||||||||||||||||||||||||||||
| start
change rate in the start year (RR_SY); normalised value |
only a negative RR_SY possible | a positive RR_SY is also
possible (= increasing emissions after 2019) |
||||||||||||||||||||||||||||||||||||||||
| -3.93% | -3.93% | -3.93% | -3.93% | -4.27% | -3.92% | |||||||||||||||||||||||||||||||||||||
| initial value[1] | -8% | 10% | -1% | 0 | 0 | RR_19 | -5.30% |
|
||||||||||||||||||||||||||||||||||
| RRt constant | a | a | a | a | RA | last RR | -2.55% |
|
||||||||||||||||||||||||||||||||||
| free parameters are determined by "goal seek" in such a way as that the budget is adhered to | -7.96% | 8.08% | -0.50939% | |||||||||||||||||||||||||||||||||||||||
| -3.77787E+16 | -0.00047120 | -0.01638827 | -0.10 | |||||||||||||||||||||||||||||||||||||||
| scenario ∑ 2020 - 2100 | Gt | 39.74 | 39.74 | 39.74 | 39.74 | 39.74 | 39.74 | |||||||||||||||||||||||||||||||||||
| budget ∑ 2020 - 2100; 'base data' sheet[2] | Gt | 39.74 | 39.74 | 39.74 | 39.74 | 39.74 | 39.74 | Should the potential for net negative emissions (NNE) be taken into account when setting the TVs? | yes | |||||||||||||||||||||||||||||||||
| emissions 2100 scenario | Gt | 0.00 | 0.00 | 0.00 | 0.00 | 0.00 | 0.00 | |||||||||||||||||||||||||||||||||||
| Emin; 'base data' sheet[3] | Gt | 0.00 | 0.00 | 0.00 | 0.00 | 0.00 | 0.00 |
|
|
|||||||||||||||||||||||||||||||||
| year Emin is achieved | 2071 | 2053 | 2057 | 2051 | 2062 | 2048 | ||||||||||||||||||||||||||||||||||||
| change rate 2030 / 1990 | -62% | -54% | -55% | -53% | -57% | -54% | base data | supple-ment | minimum values | proven values | data macro 'finding budget': | |||||||||||||||||||||||||||||||
| year emissions neutrality[4] | 2071 | 2053 | 2057 | 2051 | 2062 | 2048 | NNE | initial value TV RM-1 | Specified emissions target 2030 | 0% | RM-2 exp | RM-3 lin | RM-4 quadr | RM-5 rad | RM-6 abs | |||||||||||||||||||||||||||
| At which level of emissions (threshold value; TV) shall the annual reduction be change into a constant annual reduction amount?[5] | RM 2 - 5: | 0.10 | Gt | 3.50% | of emissions in 2019 | 0.0% | 50% | TV = Potential for net negative emissions (-NNE) + supplement |
3.50% | 3.5% | Current emissions target 2030 | 0% | -54% | -55% | -53% | -57% | -54% | |||||||||||||||||||||||||
| RM-1: | 0.13 | Gt | 4.60% | 4.50% | 85% | 4.50% | 4.5% | Specified maximum budget | Gt | |||||||||||||||||||||||||||||||||
| proven values | Current budget | Gt | ||||||||||||||||||||||||||||||||||||||||
| dashboard | check sum | 0 is ok; 1 not ok | Current year of emissions neutraltity | 2053 | 2057 | 2051 | 2062 | 2048 | ||||||||||||||||||||||||||||||||||
| RM-1 const | RM-2 exp | RM-3 lin | RM-4 quadr | RM-5 rad | RM-6 abs | 50% | Specified maximum budget | Gt | ||||||||||||||||||||||||||||||||||
| budget is adhered to | 0 | 0 | 0 | 0 | 0 | 0 | 0 | 85% | Current budget | Gt | ||||||||||||||||||||||||||||||||
| emissions in 2100 not positive | 0 | 0 | 0 | 0 | 0 | 0 | 0 | |||||||||||||||||||||||||||||||||||
| no increasing emissions | 0 | 0 | 0 | |||||||||||||||||||||||||||||||||||||||
| check sum | 0 | 0 | 0 | 0 | 0 | 0 | 0 | |||||||||||||||||||||||||||||||||||
| E_2100 is negative but not equal to E_min | 0 | 0 | 0 | 0 | 0 | 0 | ||||||||||||||||||||||||||||||||||||
| Use this link to downlad a comprehensive mathematical description of the Regensburg Model Scenario Types: | ||||||||||||||||||||||||||||||||||||||||||
| Mathematical Description of the Regensburg Model Scenario Types | ||||||||||||||||||||||||||||||||||||||||||